In markets, all times of day are not created equal. We know the open and close are important, but why? Most of us have a vague idea.
The opening range depicts the highs and lows of security prices for a specific time period after the market opens.
Day traders keep an eye on a stock’s starting range since it might give them a sense of the market’s mood and price trend for the day.
When technical analysts examine a chart, they look at the opening range as one of the multiple price ranges. Trading ranges can be a useful indicator for technical analysts. The opening range generally reflects strength, weakness, or a sideways trend with no clear sentiment.
The day’s high and low are shown on most charts, indicating the exact trading range from open to close for the current time period.
The market’s first hour is known for high trade volumes and volatility. There are numerous trading opportunities at this point in the trading session.
Traders utilize the opening range to create entry points and forecast and predict price activity for the day.
What Are Opening Range Breakouts?
The open sets the tone for the day’s trend and sentiment. However, it also has a statistical significance that is overlooked.
Because of the importance of the open and the probability of non-random price movement, the open, especially the opening range, provides us with numerous opportunities to develop trading methods.
After the market opens, the opening range is a set of highs and lows for a set time period. Typically, this is the first 30 or 60 minutes of trade, and it is one of the most crucial chart patterns for profiting the stock market.
Opening Range Breakout Screen
During this time, we must determine the day’s highs and lows. Identifying pre-market highs and lows serve as a magnet on price behavior once the stock market opens.
Trading the opening range simplifies things by providing entry and exit points. There are absolutely no grey areas when deciding where to stop.
An opening range breakout is a break from the opening range. The opening range is defined differently depending on your timeframe and testing.
When the approach originally gained popularity in the 1990s, the opening range was traditionally the first hour of trading after the open.
As time passed and traders gained access to faster data feeds and operated on shorter time frames, some traders decided to limit their starting range definition to the first half-hour, 15 minutes, and even one minute in some situations.
Many investors use the opening range of a security’s price to predict price direction before or after a major event, such as when a firm releases its quarterly earnings report.
Investors can also evaluate a stock’s opening range when evaluating its mood in connection with a potential trading opportunity.
To track the opening range, traders can use a variety of patterns, various types of technical analysis, and multiple timeframes. For example, comparing a stock’s beginning price to the previous day’s closing price might assist in predicting the day’s trend.
Bollinger Bands, which depict a support and resistance band formed two standard deviations above and below a share price’s moving average, can then be applied to the starting range. Traders can position for a breakout or reversion to the mean when price breaks the starting range band.
Some investors may choose to observe the starting price action for only a few minutes, while others may opt to wait for some time before deciding based on the opening range.
Size of the Opening Range Breakouts
Before you trade, the first thing you need to do is determine the size of the opening range. When the market begins, you should observe two candles that will help you determine the range size.
Size of the Opening Range
The first candle is generated when the market opens, and the second candle is created after the market closes.
Take the high or low of yesterday’s closing candle and the high or low of today’s opening candle to get the range size.
The size of the opening range is the difference between these two prices. We measure the range size by the green lines. The top horizontal line depicts the high opening range, while the lower horizontal line depicts the low opening range.
How to Trade Opening Range Breakout (Example)
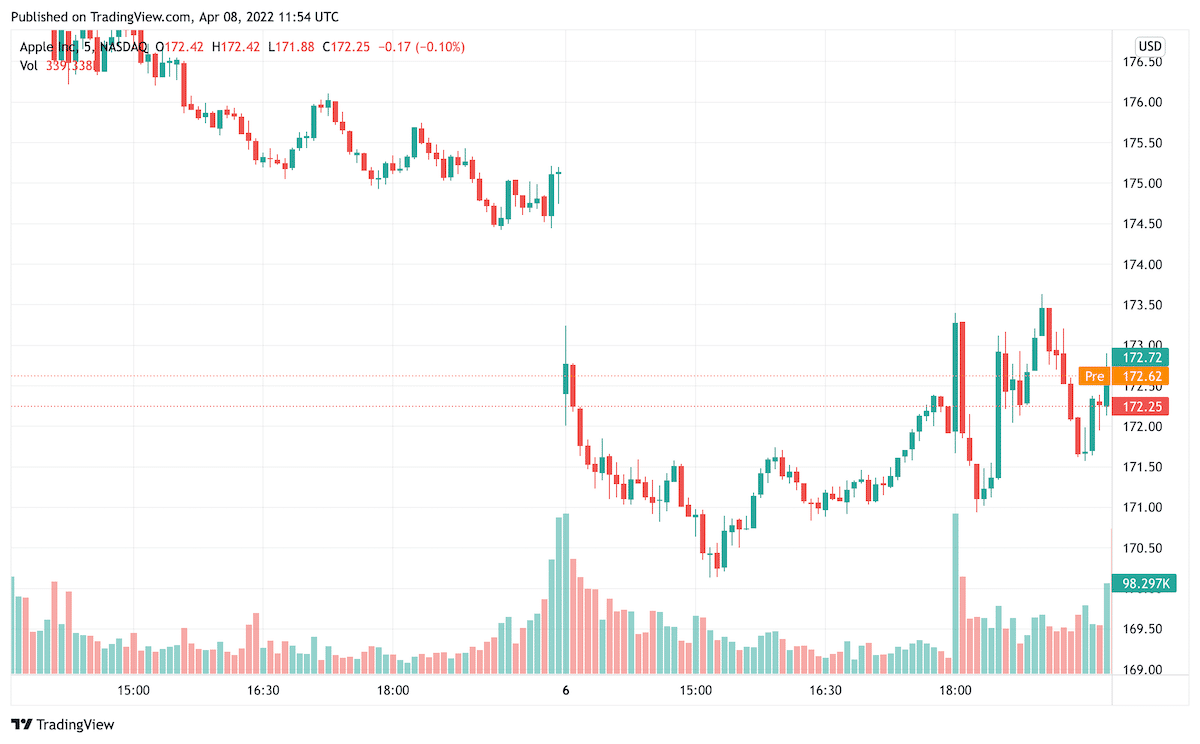
Investors and traders may keep track of opening ranges using a number of charting services. The chart below displays the opening range of a company several days after the firm reported its second-quarter (Q2) earnings.
The first 25 minutes of trading activity are represented by the opening range between the dotted trendlines, with the stock’s price printing a low of $41.08 and a high of $41.65.
A breakout above the starting range and the previous day’s high at 9:55 a.m. indicates that there will be more upside intraday momentum, and traders should favor long holdings over short positions.
Example of Trading Opening Range Breakout
Depending on risk tolerance, stop-loss orders could be placed below the breakout candle or the opening range low. Traders may choose to capture rewards by multiplying their risk. Traders might set a 60-cent profit target if they use a 30-cent stop.
Alternatively, traders can use a trailing stop to let profits run, such as quitting if the price closes below a moving average. When the stock’s price fell below the 10-day simple moving average (SMA) at 11:50 a.m., investors who followed this exit strategy were stopped.
Opening Range Breakout Trading Strategy
The opening bell of the stock market can be approached in a variety of ways. Let’s have a look at a day trading strategy:
Early Morning Range Breakout
This is one of the most extensively used formulas for opening range success. The early morning range breakout is concerned with the size of the gap and the high/low of the breakout.
When we identify the boundaries of gaps in this strategy, we must trade in the breakout direction. Later in the day, breakouts should be treated with caution.
When trading the early morning range breakout, always use a stop-loss order. The midpoint of the gap should be used as the stop loss. With two parallel lines, the opening range is defined. We enter a trade when the price breaks the upper level of the early morning range. The stop loss must be in the midpoint of the trading range.
Chart Pattern Gap Pullback Buy
This strategy works with bullish gaps. When we see a bullish gap on the chart, the price instantly starts moving in the opposite direction of the gap.
The pullback is the term for this. The pullback would be bearish because the gap is bullish. The goal of this method is to predict when the retreat will cease.
When using this approach, it’s essential to know when to buy the retreat.
Chart Pattern Gap Pullback Buy
Looking for a reversal candlestick pattern is one way to achieve this. After seeing a reversal, wait for confirmation before entering a long trade.
Additionally, your stop is placed below the opening range’s lowest point. You should keep your trade open for at least a bullish move equal to the gap size.
Gap Reversal
Another technique to approach the opening morning range of stock is the gap reversal strategy. It is a gap reversal when the price produces a gap, but the range breaks oppositely.
When the gap is bullish, the price breaks the lower level of the opening range, signaling a gap reversal. When the gap is bearish, the price breaks the higher level of the opening range, signaling a gap reversal.
Gap Reversal
When you open a gap reversal trade, you must use a stop-loss order to protect your investment. The midpoint of the opening range acts as the stop loss.
Trading Edge and Its Importance to a Trader?
A trading edge is a strategy, observation, or approach that allows you to gain a financial advantage over other market participants. It doesn’t have to be complicated to accomplish its goal.
Finding an edge and understanding what it means will help you decide if it’s worth your time to look for one or whether it’s achievable or usable.
Anything that adds a few points to the winning side of an equation creates a lifetime advantage. Don’t get discouraged if you haven’t located one yet; most traders are unaware of its existence. It’s the main reason why a few people make a lot of money while everyone else makes a lot of losses.
Market prices are efficient most of the time, which means they are a true reflection of value. The market discounts available information in a fraction of a second to hours.
The majority of the time, price action fluctuates at random. That is, trading is a zero-sum game. It’s a game akin to gambling in that it’s completely random.
Traders are no different from gamblers without a proper trading advantage. Even if a trader is lucrative in the short term without a trading edge, it is impossible to profit in the long run.
As long as unpredictability dominates trading results, a trader cannot live without a trading advantage.
Traders often believe in focusing on performance psychology and adopting a positive mindset. They feel that resolving psychological concerns and finding the correct trading strategy can result in huge profits. This they think is a trading advantage. None of these have a trading edge.
Many tip givers, technical gurus, and easy-to-win propagators regularly encourage newbies to adopt this mindset.
Everything else is a waste of time if you’re not trading with a positive expectation of the markets. Positive expectancy accounts for a significant portion of the trading edge. Positive expectation, however, does not compensate for everything.
Positive thinking, money management, and discipline are still required. They work together to create a trade advantage. None of them is a stand-alone idea.
Discipline, money management, positive attitude, and anticipation have significant value since they develop a trading edge.
Day Trading and Swing Trading
Day Trading
To define day trading, it is a type of securities speculation in which a trader buys and sells stock on the same trading day to prevent unmanageable risks and negative price gaps between one day’s close and the next/succeeding day’s price at the open. Traders who engage in this type of trading are known as speculators.
Day Trading
Using technical analysis and advanced charting techniques, day traders make dozens of deals in a single day.
A day trader’s purpose is to make a living by trading stocks, commodities, or currencies often and profitably while limiting losses. Day traders seldom keep assets or securities overnight.
Day traders prefer increased market volatility since it means they’ll experience more price movements in a shorter amount of time, which means they’ll have a better opportunity of profiting. Markets are often the most volatile between the formal open and close periods.
Swing Trading
Swing trading is a trading strategy that entails maintaining positions for several days or weeks in the hopes of profiting from the market’s momentum.
Swing trading is concerned with capturing a fraction of a larger general trend rather than second-to-second price changes in a market.
Swing traders are not required to stare at a computer screen all day. Swing traders will set their risk and reward objectives before letting the position run on autopilot until it closes with a profit or loss.
Swing Trading
Swing traders aren’t looking to make a million dollars in a single transaction. Because they open fewer positions, swing traders pay lower transaction fees to their brokers than day traders.
Swing traders will keep positions overnight, and if they’re trading FX, they’ll have to pay overnight financing fees. Swing traders understand that no single deal will make or break their success; therefore, they trade less frequently and pay lesser transaction fees to their broker.
Difference between Swing Trading and Day Trading
Swing traders engage in trading for days, weeks, or even months. On the other hand, day traders open and close multiple positions in a single day.
Transactions Placed
Swing trading is still a fast-paced trading method, but it entails trading over days, weeks, or months at a time.
As a result, swing trading accumulates profits and losses more slowly than day trading. Some swing traders can result in significant wins or losses very quickly.
Day traders are attracted to day trading because they want to compound their winnings quickly. The activity of traders buying and selling assets on the same day, frequently many times per day, is called day trading.
Time Needed
Day trading and swing trading both require time to build a plan and become consistent to succeed. Day trading requires you to keep observing your computer screen for long periods and, when compared to swing trading, provides a poor Return on Investment (ROI) – the investment here being your time.
Swing trading can save time when compared to active trading. Swing trading on a daily chart, for example, may take less than an hour every night to discover new trades and update stop orders on current holdings. You need to place new trade orders if the strategy indicates that you should.
You may only be required to look for trades and change orders once a week if you place deals that last several weeks or months, lowering your time commitment to around an hour per week rather than per night.
It is usual for day traders to do trading for at least two hours each day. When you add in time for preparation and chart/trading review, you’re looking to have to spend 3 to 4 hours on the desktop.
When you trade for more than a few hours each day, your time commitment skyrockets, and trading becomes a full-time profession.
Compared to Day Trading, How Profitable is Swing Trading?
Swing trading is an excellent method to get started with trading. It helps you build a ‘feel’ for market movements, learn new trading methods, and design a trading system compatible with you as the system is.
This compatibility might help you relax and increase your chances of making money. However, you must adhere to your system regularly to achieve consistent outcomes.
Day traders must commit to shifting market volatility and be rapid with their deals; yet, this might increase their stress levels, leading to poor decision-making.
Day trading necessitates sustained focus for extended periods due to the high pace and brief windows of opportunity. Swing trading needs to focus just as much as day trading, but the period between activities, such as entering and quitting positions, is longer.
Swing traders and day traders alike must be well-capitalized, having enough money in their accounts to withstand losses and their errors.
How Day Trading the Opening Range Differs from Swing Trading
Any span during the first 10-minutes of the opening range is generally referred to as the intraday opening range. For example, if a trader uses a 30-second or 5-minute opening range, he can adjust the scale-up by holding positions longer, with greater stops, and taking profits.
10-minutes, 15-minutes, or even 30-minutes are all viable options. Also, major economic news after 10 a.m. boosts volatility and volume. This means that the intraday trading range is 9:30 a.m. to 10:30 a.m. Any timeline within this time frame is acceptable.
If you’re a swing trader, you can wait for the first hour to finish before making a decision. As a day trader, the first 15 to 30 minutes are usually enough to get a feel of the market’s direction.
As a day trader, you should consider the opening range to be anything that occurs inside the first 15 minutes of trading. You can look at the first 30 minutes if you plan to be a day trader with a few hours of holding period. Swing traders should wait out the first volume balancing. At 10:30 a.m., the initial balance expires after 60 minutes.
More Articles From Wealthy Living
- Best High Dividend Stocks: The Ultimate Millenials Investment Guide
- Dividend Kings Stocks That You Should Add to Your Watchlist Right Now
- Everything You Should Know About Rick Ross’ Net Worth and Other Facts
- Discover Blippi’s Net Worth and Other Fun Facts
Disclosure: The author is not a licensed or registered investment adviser or broker/dealer. They are not providing you with individual investment advice. Please consult with a licensed investment professional before you invest your money.
Tim Thomas has no positions in the stocks, ETFs, mutual funds, forex, or commodities mentioned.
This was produced and syndicated by Wealthy Living.
Featured image credit: Shutterstock.